Confused about Historical Days of Supply
I was under the impression that historical days of supply was a metric that applied exclusively to my inventory at the parent ASIN level, but now I see that it is not. Typically, as used media sellers, we list and stock only one unit per ASIN, which is the case for the items in the screenshot below. How is this metric calculated? Does the metric include the FBA inventory of all 3rd-party sellers and for Amazon?
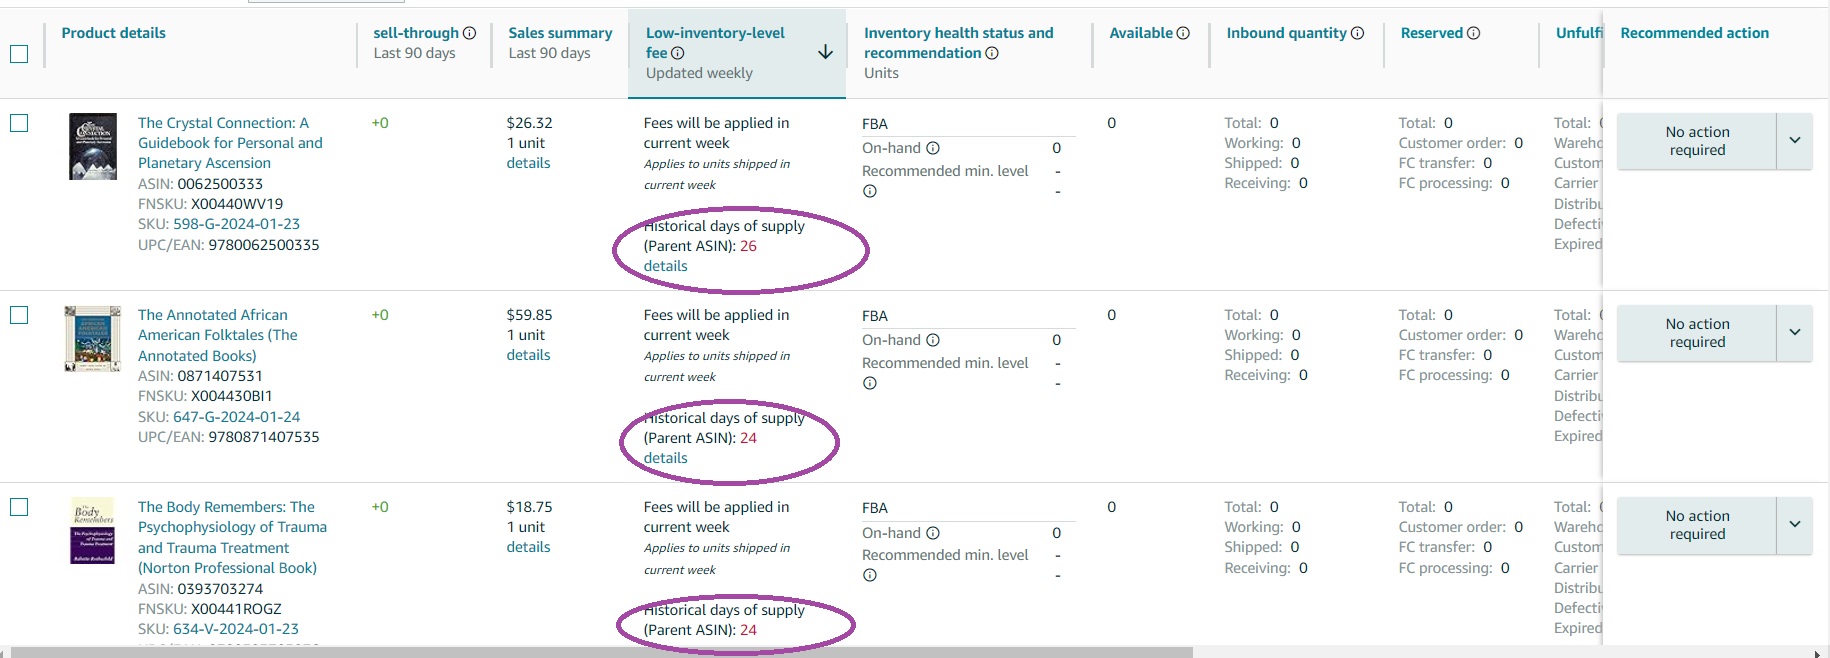
For example, in the screenshot below, the historical days of supply for the first ASIN 0062500333 is 26. At the time of this writing, there are four FBA sellers, including Amazon, listing their book under this ASIN, and the 1 quantity that we had recently sold out. Does this mean that, over a certain period of time, all FBA sellers have an average combined inventory of 26 units located at fulfillment centers per day? Or is some kind of Amazon proprietary algorithm used?
I know this is a basic question, but I still don't understand.
Confused about Historical Days of Supply
I was under the impression that historical days of supply was a metric that applied exclusively to my inventory at the parent ASIN level, but now I see that it is not. Typically, as used media sellers, we list and stock only one unit per ASIN, which is the case for the items in the screenshot below. How is this metric calculated? Does the metric include the FBA inventory of all 3rd-party sellers and for Amazon?
For example, in the screenshot below, the historical days of supply for the first ASIN 0062500333 is 26. At the time of this writing, there are four FBA sellers, including Amazon, listing their book under this ASIN, and the 1 quantity that we had recently sold out. Does this mean that, over a certain period of time, all FBA sellers have an average combined inventory of 26 units located at fulfillment centers per day? Or is some kind of Amazon proprietary algorithm used?
I know this is a basic question, but I still don't understand.
6 replies
Bryce_Amazon
Greetings @Seller_yJrgQZVX1vxTR,
Happy to provide some additional information! Thankfully, the metric calculation is not proprietary and how it's calculated is published within Seller Central.
First, Historical Days of Supply is calculated based on average daily inventory units on hand divided by average daily shipped units, over both the long term (last 90 days) and short term (last 30 days). The following are the definitions for the metric components:
- Average daily inventory units is sellable FBA inventory units in our US fulfillment network only. It is calculated by adding up inventory units available for sales, units that are being transferred between fulfillment centers, and units reserved that are not currently needed to meet immediate customer demands. It does not include unsellable units such as pending removal or disposal or liquidation units.
- Average daily shipped units is all units shipped from our US fulfillment network, regardless of customer location. For example, units shipped to customers outside of the US through Remote fulfillment with FBA are included if the units ship from our US fulfillment network.
The metric is calculated at the account level, so it shouldn't be factoring the other four FBA sellers.
Follow-up question: when you hover over the "Details" link under each Historical Days of Supply, what do you see? That will give you the breakdown of how the metric was calculated for that specific ASIN.
- Bryce
Bryce_Amazon
Good morning,
Thanks for providing the screenshot!
I see your comment below, but just to ensure you (and anyone else in the future who sees this) fully understand:
In your example, the number 16 comes from your average daily shipped units for the past 30 days, divided by your average daily on hand units for the past 30 days. The same for the long term, but that looks at the past 90 days. Whichever is higher of the two, that's what you'll see as your historical days of supply!
- Bryce